Viewing results
You can open, create and manage Result Sets on the Result Sets screen.
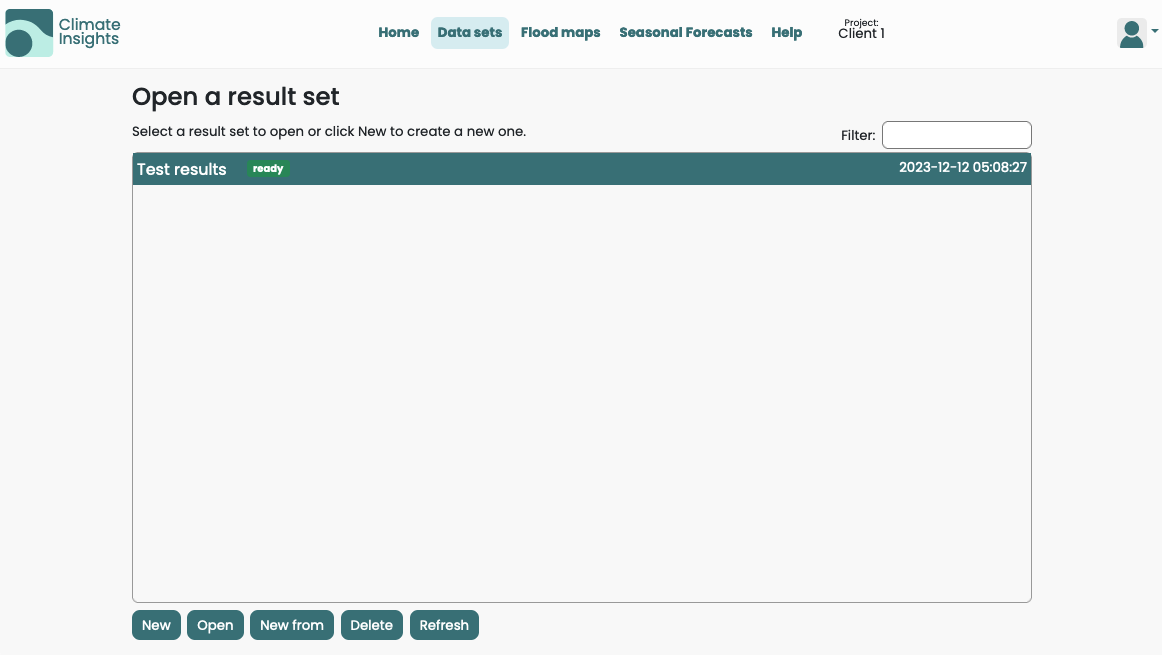
To view a Result Set, open the Result Sets screen (by selecting a Project on the Welcome screen), select a Result Set (that has been successfully processed, indicated by a green "ready" label) and click “Open”. The Result Viewer dialog box will be displayed.

Result Viewer
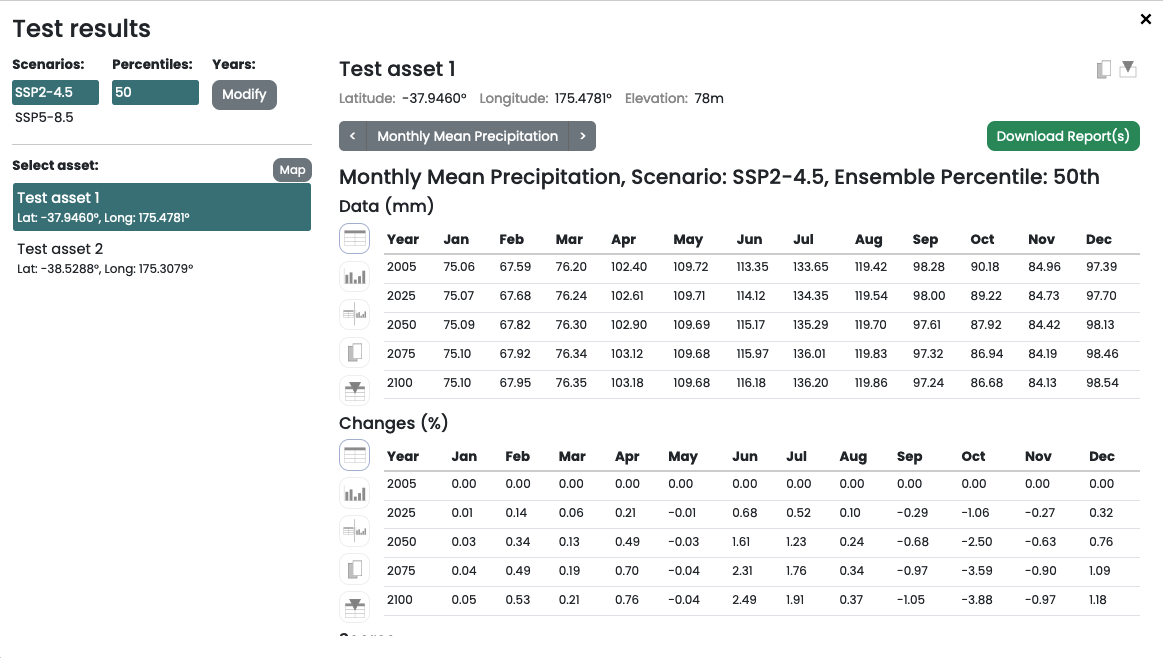
The Result Viewer dialog box displays table sets (tables and charts) for the selected Asset, Variable, Scenario and Percentile. Each table set is also presented with a set of Risk Scores, if the Variable supports it. Each table set contains one table with projections and one which shows the change from baseline.

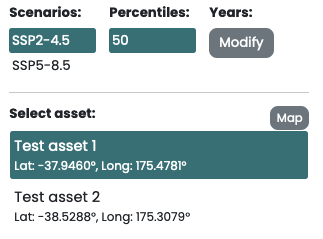
The left side of the Result Viewer allows you to select which Scenarios and Percentiles you'd like to display, and which asset you'd like to view data for. Click the “Years” button to change which years are displayed in tables and charts (2005 to 2100 in five-year time steps).

Above the main table area, there are buttons that allow you to select the variable you'd like to view. Clicking “Variable name” will display a drop-down with all available variables in the Result Set.

There is a toolbar at the side of each table with viewing and exporting options. The view buttons allow you to toggle between table view, chart view and combined (table and chart, side by side) view. The exporting buttons allow you to quickly save or copy a table to a file/clipboard. Click here for information on exporting complete data sets.

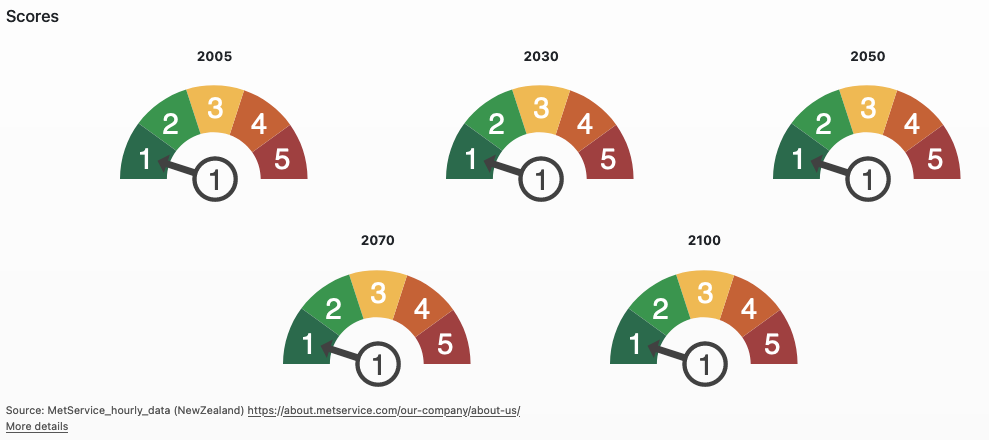
There is a series of Risk Score graphics under each table set. Not all Variables have Risk Score data.

Click here for information on exporting data.