Timeseries Data Explorer

The Timeseries Data Explorer allows you to view and work with Site Specific Timeseries data and databases. To access a database, it must first be referenced in the Project Manager.
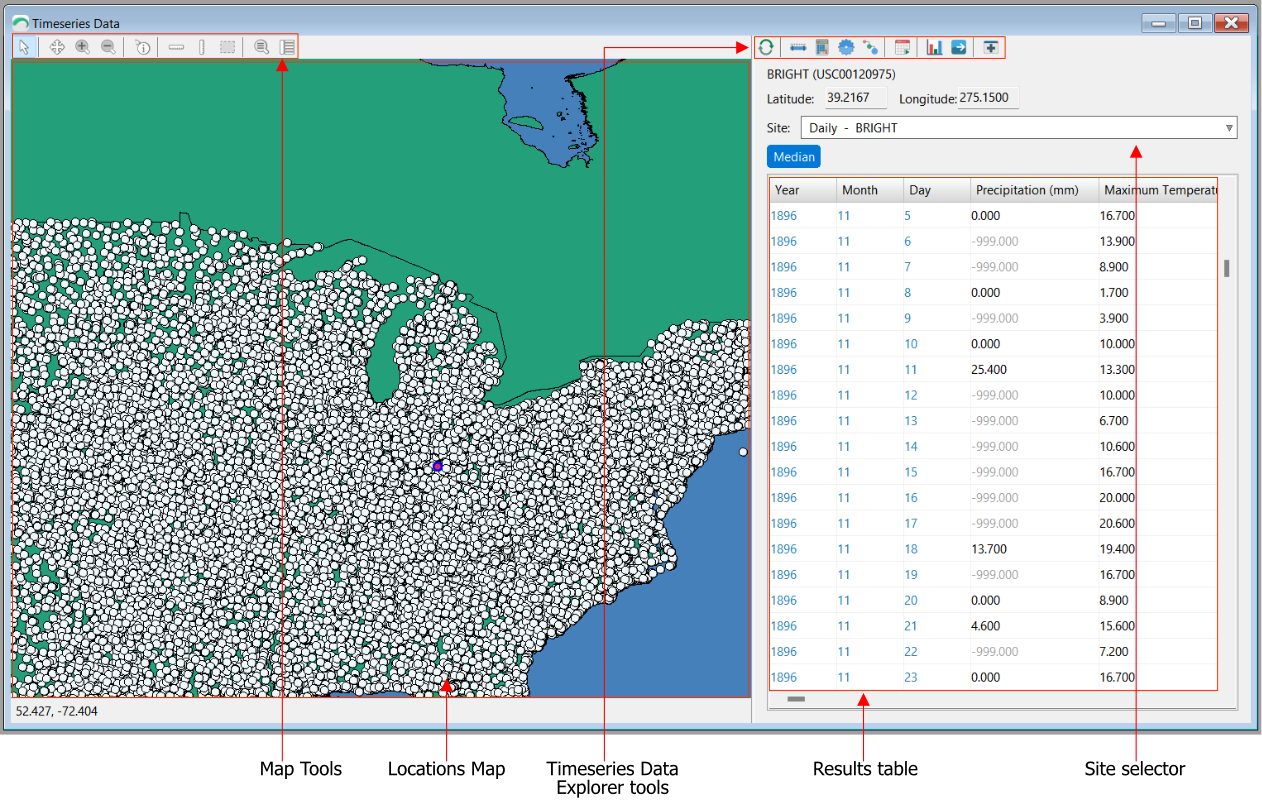
Toolbar tools
 Refresh:
Reloads the original data. Any processing (Scenario, Long Term Normal, Aggregate etc) will be lost. Viewing Period:
Sets the time period for the current dataset Long Term Normal:
Calculates the long term averages of the data. Scenario Generator:
Apply a future scenario to the timeseries dataset. Aggregate:
Aggregates the timeseries data into a coarser resolutions (e.g. converting a daily dataset into a monthly dataset). Goto Date:
Allows quicker navigation through the dataset, scrolling the table view to the specified date. Chart:
Display the timeseries data in chart form. Export as CSV:
Exports the current table view as a CSV file. Split:
Copies the data and displays the results in a new window.
Table colors
- Values are displayed with a black color
- Nodata values are displayed with a light gray color
- Date values are displayed with a blue color