Spatial Scenario Generator

The Spatial Scenario Generator allows you to create a spatial data set for a given Study Area, Pattern (or Ensemble) and future year. The output will be displayed as a raster image in a Map Viewer window.
Selecting options
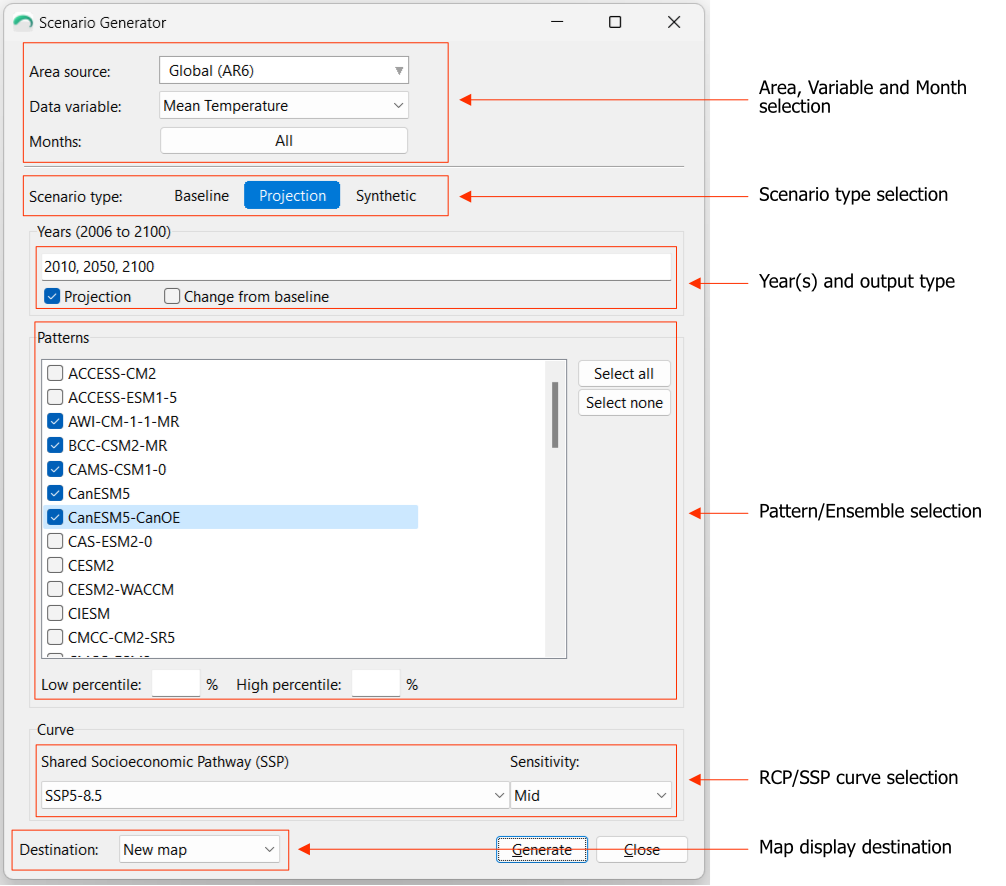
- Area, Variable and Month selection: The Study Area, which provides the source data (baseline and patterns) must be selected. The first time the Scenario Generator is opened it will default to the selected "Study Area" from the main window. On subsequent opens it will remember the last selected area. The desired variable and months should be selected next. Note that different data sets may contain different sets of variables.
- Scenario type selection: The type of scenario should then be selected. Baseline will produce a result using only the baseline data. Projection will produce a result using the selected Pattern/Ensemble and RCP/SSP.
- Patterns/Ensemble selection (Project scenario type): Select a Pattern (or Ensemble) by checking the check box(es) next the names of each desired pattern. When an Ensemble is selected, an optional Low (e.g. 10%) and High (e.g. 90%) percentile output can also be generated. The Select all/none buttons can be used to quickly select all patterns to create an Ensemble.
- RCP/SSP Curve selection: Select a desired RCP (AR5)/SSP (AR6) and sensitivity.
- Map display destination: This drop-down box allows you to select the Map to display the outputs. New map (default) displays the results in a new map window, Current map displays the results in the currently opened Map window (if there is one) as a new layer, and Separate maps will create a new Map window for each output (e.g. if more than one year is selected).
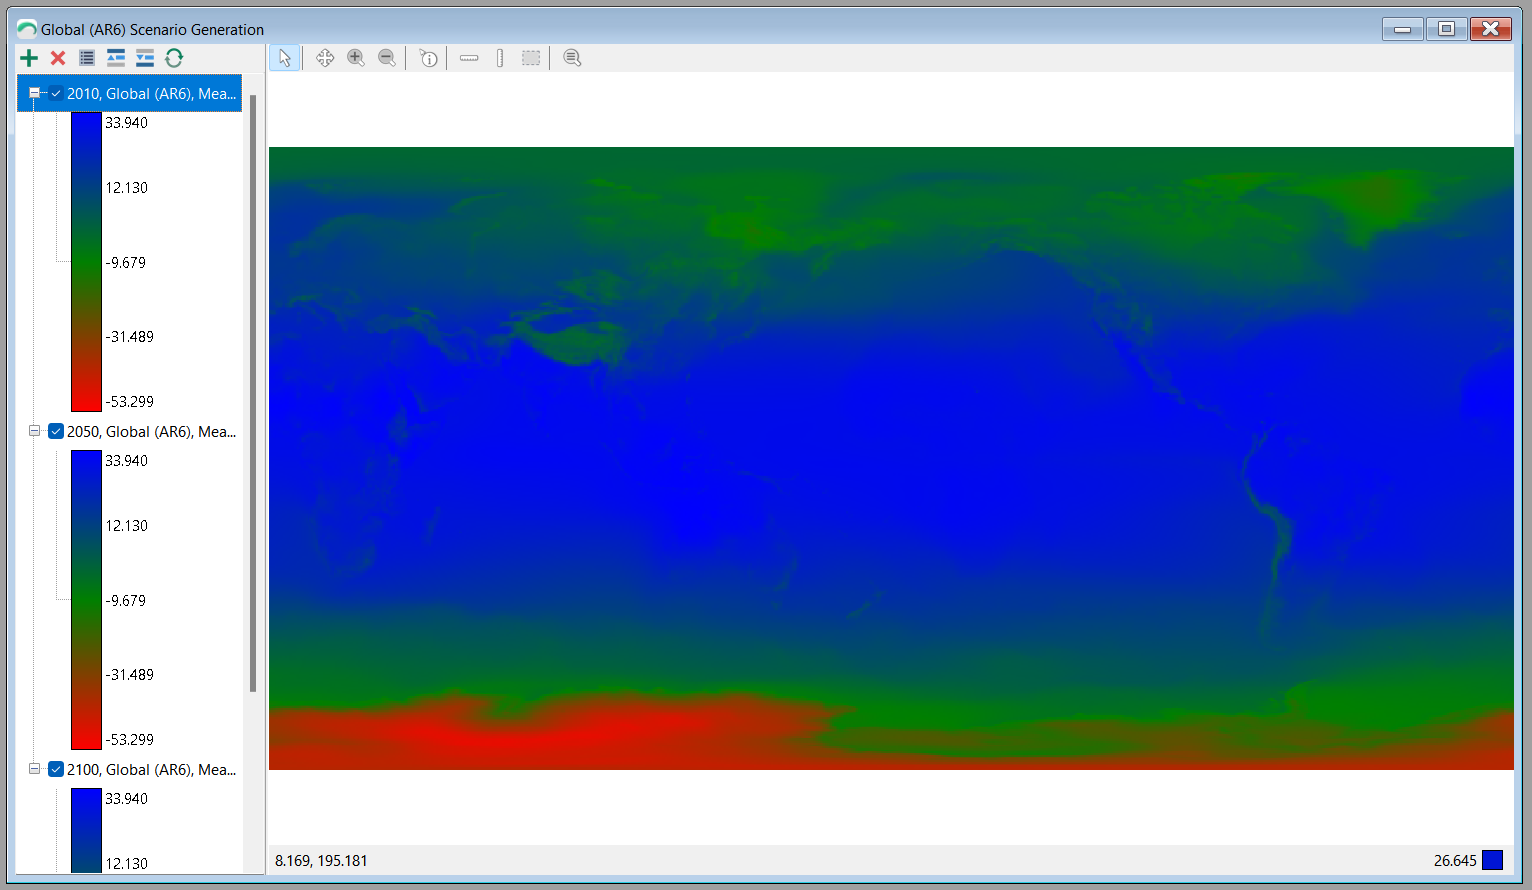
Once all required selections have been made, press the Generate button. The results will be displayed in a map window, for example: