SSPs and RCPs
Choosing a Representative Concentration Pathway (RCP) or Shared Socio-economic Pathway (SSP) for examination in a project should be based on a consultative process. Here we outline some of the current thinking we have had on defining RCPs and SSPs for various clients in project work and given the latest Conference of Party (COP) discussions we have tried to make it as up-to-date as possible and bring to the discussion consideration of Intended Nationally Determined Contributions (INDCs) and potential limitations in societal capacity for achieving not only a reduction in greenhouse gas emissions but a decarbonisation of the world economy. We have taken a pragmatic approach that explores the big picture issues rather than diving deeply into individual and nuanced aspects of each and every possibility that could impact change.
This section provides an overview of some key differences between CMIP5 and CMIP6. A noticeable difference between the two is that CMIP5 data entails Representative Concentration Pathways (RCPs) such as RCP2.6, RCP4.5, RCP6.0 and RCP8.5. In comparison, CMIP6 uses Shared Socioeconomic Pathways (SSPs), including SSP 1-1.9, SSP1-2.6, SSP2-4.5, SSP4-6.0, and SSP5-8.5.
For example, the broad SSP2 is a scenario where the world follows a path where social, economic, and technological trends do not shift markedly from historical patterns. Comparably, SSP5 is a scenario where the world places increasing faith in competitive markets, innovation, and participatory societies to produce rapid technological progress and the development of human capital as the path to sustainable development.
CMIP6 consists of the ‘runs’ from around 100 distinct climate models being produced across 49 different modelling groups. These models are running several new and updated emission pathways that explore a much more comprehensive range of possible future outcomes than were included in CMIP5. While the results from 44 monthly CMIP6 models have been published at the time of the analysis undertaken for this report. In general, several models have a notably higher climate sensitivity than models in CMIP5. This higher sensitivity contributes to projections of greater warming this century – around 0.4C warmer than similar scenarios run in CMIP5 – though these warming projections may change as more models become available. Specifically, a set of scenarios were chosen to provide a range of distinct end-of-century climate change outcomes.
Several new scenarios are also being used for CMIP6 to give scientists a wider selection of futures to simulate. These scenarios are included in the table below, which shows the radiative forcing levels to 2100. The new scenarios that can be applied for risk and vulnerability assessments are limited to the following five: SSP1-1.9, SSP1-2.6, SSP2-4.5, SSP3-7.0 and SSP5-8.5.
As with CMIP5, there is a range of models available for application with CMIP6 depending on the variable being applied. This is important when applying methods for variables such as wind and for extreme analysis for rainfall that require sub-monthly data. Historically, such as with CMIP3, only monthly rainfall patterns were available. With CMIP4 daily patterns were released, which led to a revolution in extreme event analysis. It became apparent that daily extreme rainfall could increase in intensity with climate change while monthly and annual rainfall could decrease. With CMIP5 models including 6 and 3 hourly rainfall, it permitted higher temporal resolution analysis and led to even greater evidence that short term extreme rainfall events could increase in intensity while monthly and annual rainfall could either vary little over time or decrease.
The Representative Concentration Pathways (RCPs) are four greenhouse gas concentration (not emissions) trajectories adopted by the IPCC for its Fifth Assessment Report (AR5). The four RCPs, RCP2.6, RCP4.x, RCP6.0, and RCP8.5, are named after a possible range of radiative forcing values in the year 2100 (of 2.6, 4.x, 6.0, and 8.5 W/m2, respectively) (Table 1).
Table 1. Overview of representative concentration pathways (RCPs) (van Vuuren et al. 2011; Moss et al. 2010; Rojeli et al. 2012)
|
Descriptiona |
CO2 Equivalent |
SRES Equivalent |
Publication – IA Model |
|
|
RCP8.5 |
Rising radiative forcing pathway leading to 8.5 W/m2 in 2100. |
1370 |
A1FI |
Raiahi et al. 2007 – MESSAGE |
|
RCP6.0 |
Stabilization without overshoot pathway to 6 W/m2 at 2100 |
850 |
B2 |
Fujino et al.; Hijioka et al. 2008 – AIM |
|
RCP4.0 |
Stabilization without overshoot pathway to 4.x W/m2 2100 |
650 |
B1 |
Clark et al. 2006; Smith and Wigley 2006; Wise et al. 2009 – GCAM |
|
RCP2.6 |
Peak in radiative forcing at ~ 3 W/m2 before 2100 and decline |
490 |
None |
van Vuuren et al., 2007; van Vuuren et al. 2006 - IMAGE |
a Approximate radiative forcing levels were defined as ±5% of the stated level in W/m2 relative to pre-industrial levels. Radiative forcing values include the net effect of all anthropogenic GHGs and other forcing agents.
Shared Socioeconomic Pathways for IPCC AR6
The GCM data in SimClim is from CIMP6, the data source for IPCC AR6 climate change projections. For more information on CMIP6, please visit https://esgf-node.llnl.gov/projects/cmip6/.
When applying CMIP6, its ancestor CMIP5, usually has to be mentioned as they share many common concepts. A short overview of the critical differences between CMIP5 and CMIP6 is provided. The vital difference between CMIP5 and CMIP6 is the future scenarios. The CMIP5 used the Representative Concentration Pathways (RCPs) to describe future scenarios such as RCP2.6, RCP4.5, RCP6.0, and RCP8.5. The CMIP6 applied the Shared Socioeconomic Pathways (SSPs), including SSP 1-1.9, SSP1-2.6, SSP2-4.5, SSP4-6.0, and SSP5-8.5 (Figure 1).
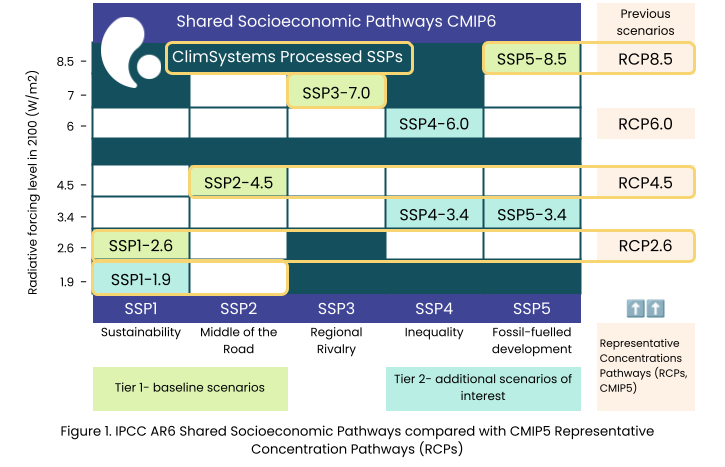
Figure 1: IPCC AR6 Shared Socioeconomic Pathways compared with CMIP5 Representative Concentration Pathways (RCPs)
For example, the broad SSP2 is a scenario where the world follows a path where social, economic, and technological trends do not shift markedly from historical patterns. Comparably, SSP5 is a scenario where the world places increasing faith in competitive markets, innovation, and participatory societies to produce rapid technological progress and the development of human capital as the path to sustainable development.
In general, several models have notably higher climate sensitivity than models in CMIP5. This higher sensitivity contributes to projections of more significant warming this century – around 0.4oC warmer than similar scenarios run in CMIP5 – though these warming projections may change as more models become available. Specifically, scenarios were chosen to provide a range of distinct end-of-century climate change outcomes.
Several new scenarios are also being used for CMIP6 to give scientists a wider selection of futures to simulate. These scenarios are included in the chart below, which shows the radiative forcing levels to 2100. The new scenarios that can be applied for risk and vulnerability assessments are limited to the following five: SSP1-1.9, SSP1-2.6, SSP2-4.5, SSP3-7.0, and SSP5-8.5.
- SSP1: The sustainable and “green” pathway describes an increasingly sustainable world. Global commons are being preserved; the limits of nature are being respected. The focus is more on human well-being than on economic growth. Income inequalities between states and within states are being reduced. Consumption is oriented towards minimizing material resources and energy usage.
- SSP2: The “Middle of the road” or medium pathway extrapolates the past and current global development into the future. Income trends in different countries are diverging significantly. There is certain cooperation between states, but it is barely expanded. Global population growth is moderate, leveling off in the second half of the century. Environmental systems are facing a certain degradation.
- SSP3: Regional rivalry. A revival of nationalism and regional conflicts pushes global issues into the background. Policies increasingly focus on questions of national and regional security. Investments in education and technological development are decreasing. Inequality is rising. Some regions suffer drastic environmental damage.
- SSP4: Inequality. The chasm between globally cooperating developed societies and those stalling at a lower developmental stage with low income and a low level of education is widening. Environmental policies are successful in tackling local problems in some regions but not in others.
- SSP5: Fossil-fueled Development. Global markets are increasingly integrated, leading to innovations and technological progress. The social and economic development, however, is based on an intensified exploitation of fossil fuel resources with a high percentage of the coal and an energy-intensive lifestyle worldwide. The world economy is growing, and local environmental problems such as air pollution are being tackled successfully.