Extreme Event Analysis

The Extreme Event Analysis window is split into two sections - the map section and the inputs section. The map section displays all available sites for the selected site database. The inputs section lets you choose the parameters for the extreme analysis.
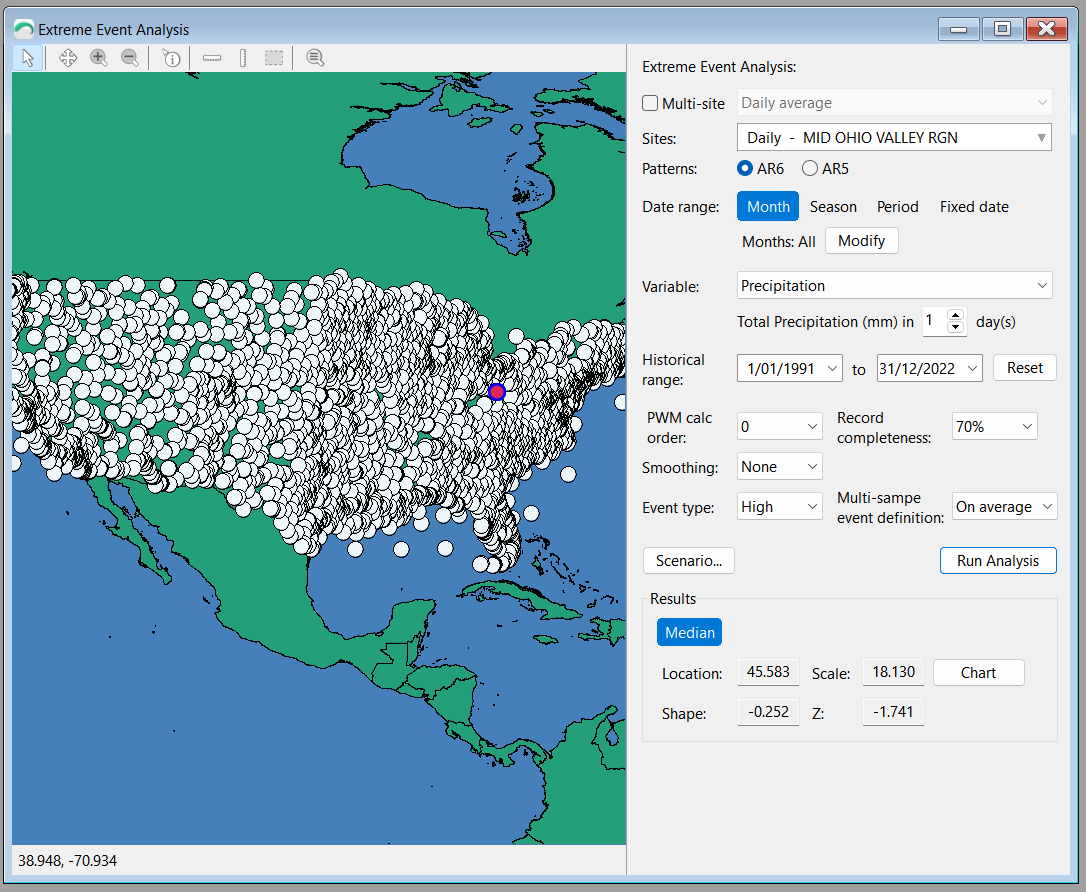
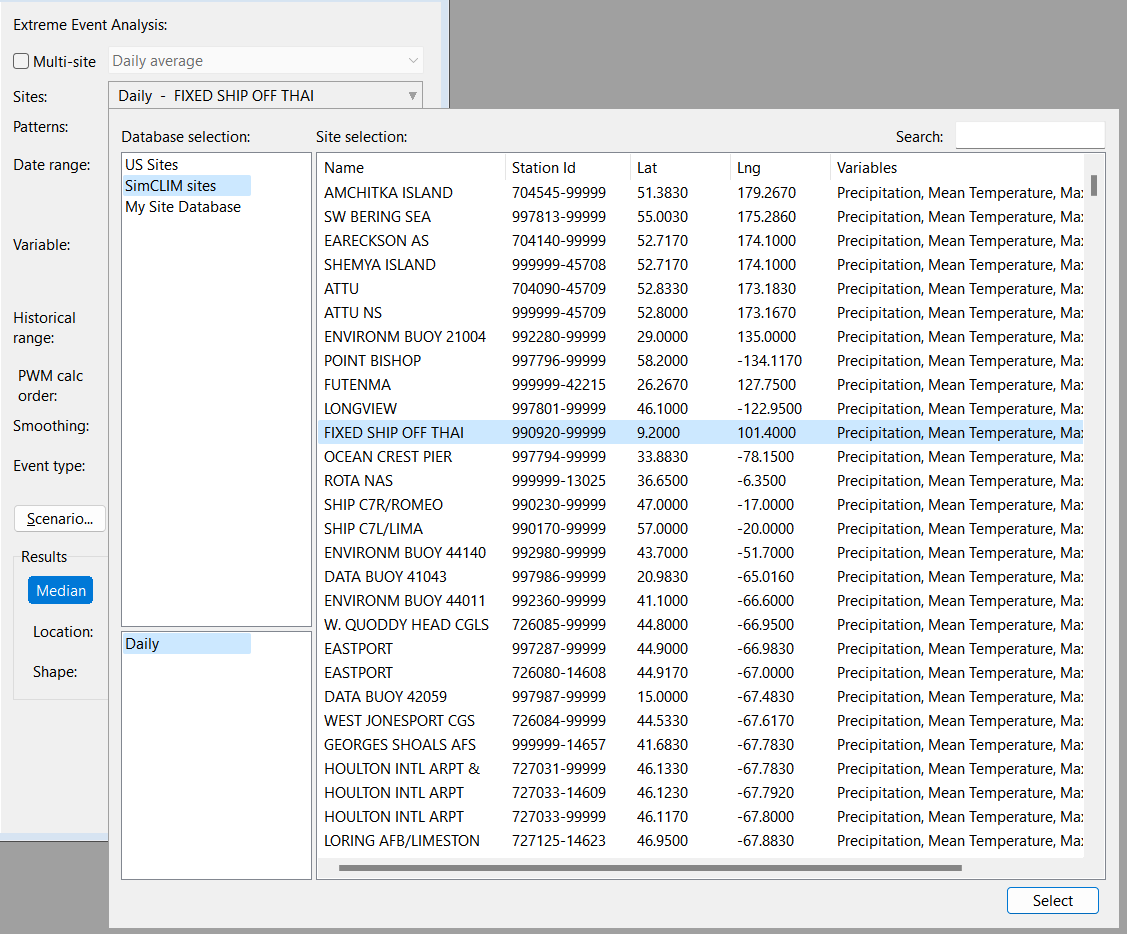
- Click the Sites drop down button to show the Site Browser. Select a Database and Time Scale (e.g. Daily) on the left side and select a Site that you'd like to run analysis on.
- Select the Pattern set (AR5 or AR6)
- Choose a Date Range (Month, Season, Period or Fixed Date).
- Choose a Variable and associated parameter (e.g. Total Min Temperature/Max Temperature/Precipitation in [x] Days)
- Select a desired Historical Range. The automatically selected value should include the entire data range for the selected Site.
- Select additional parameters as required.
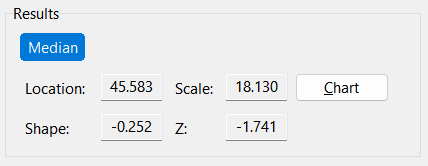
- Click the Run Analysis button. Results will be displayed at the bottom of the window:
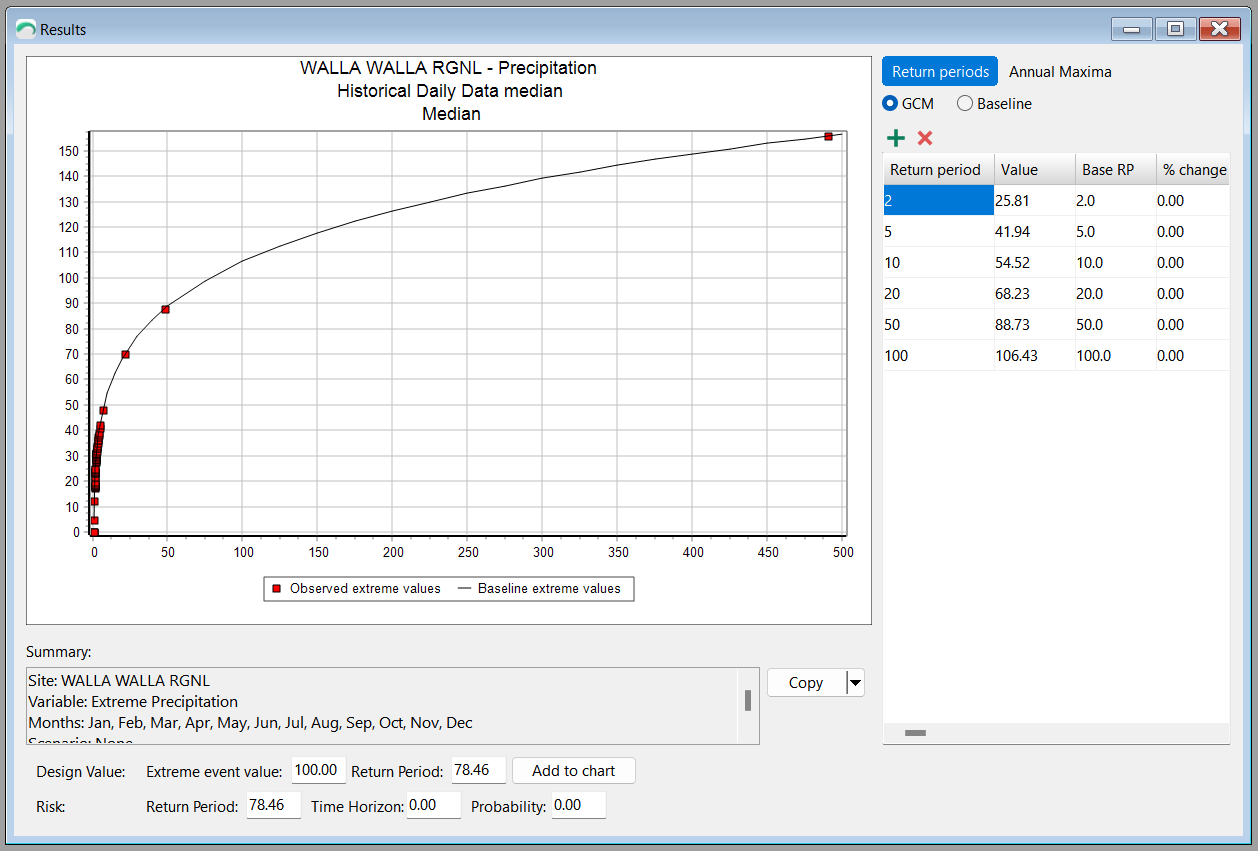
- Click the Chart button to explore the results further.
- Press the Scenario button and re-run the analysis to analyze results with climate change applied.